
The 2024 Taiwan Earthquake: Crustal deformation detected by ALOS-2 data
|
Released: Apr. 5, 2024, update: Apr. 17 2024, update: May 10 2024 Japanese version of this page SummaryM7.7 (Japan Meteorological Agency; JMA) earthquake occurred in Taiwan on April 2, 2024 (UTC). To measure the crustal deformation caused by this earthquake, we applied interferometric analysis using ALOS-2/PALSAR-2 data. The analysis clearly revealed the spatial distribution of crustal deformation.
InSAR pair
*1 F: Stripmap (Fine), W:ScanSAR(Wide) (cf. ALOS-2 Project / PALSAR-2 (JAXA)) 2.5-Dimensional analysis
Fig. 1 Quasi-vertical Displacement
Fig. 2 Quasi-east-west Displacement
Fig. 3 The cross-section of 2.5D displacement distribution along line A-B. SAR Interferograms
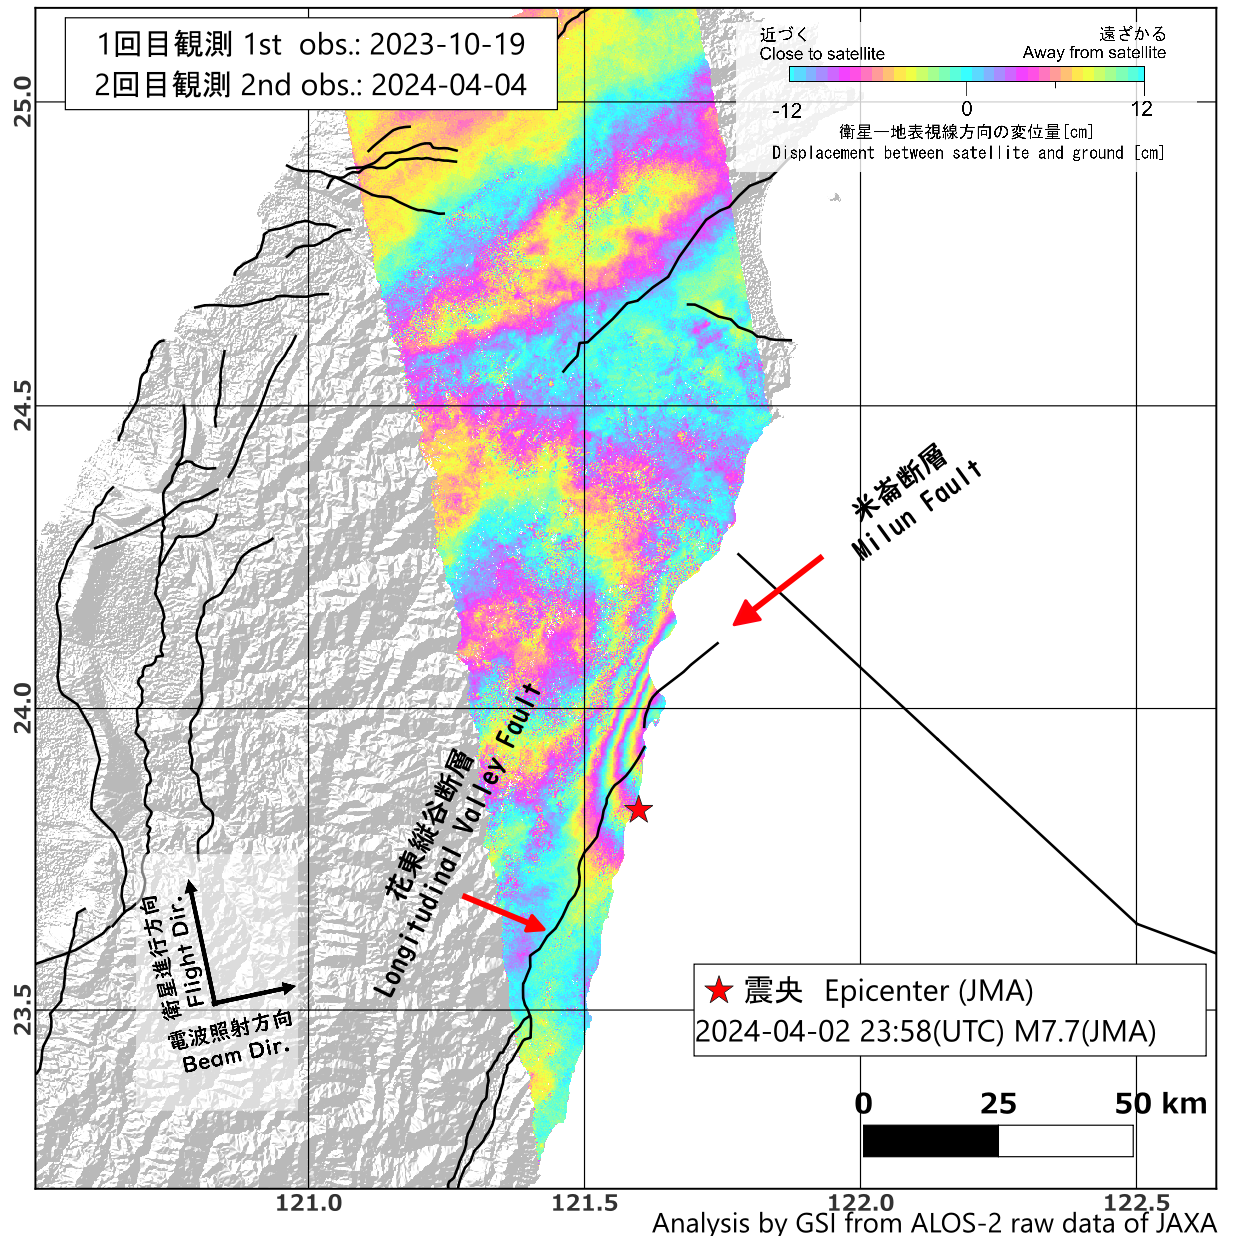
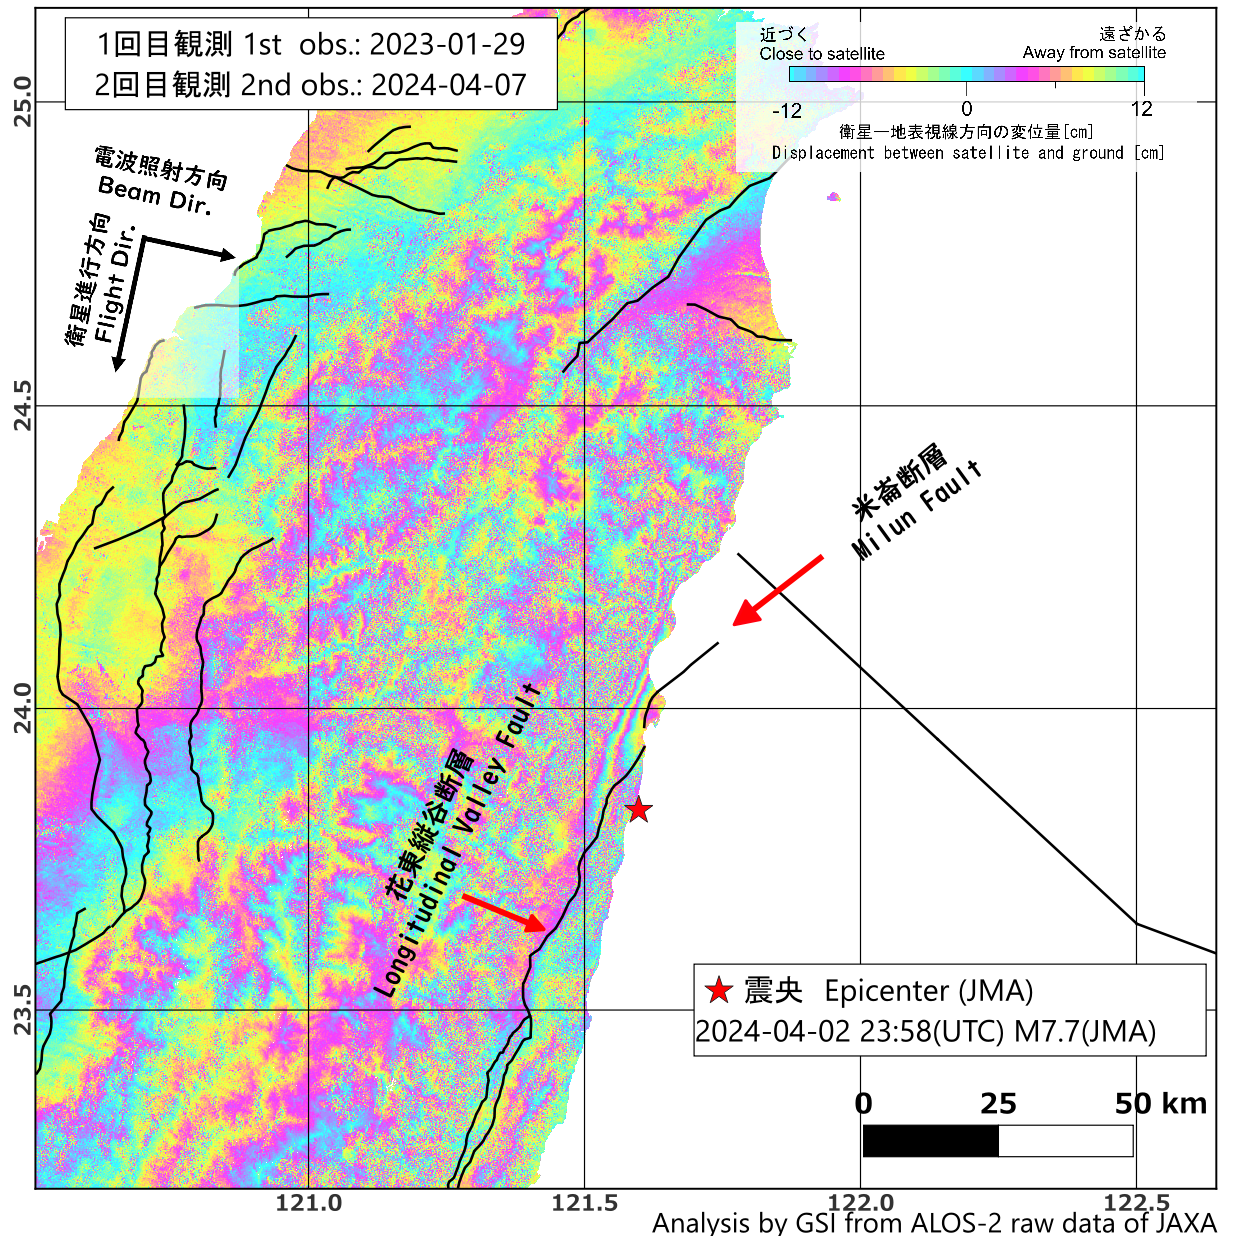
Fig. 4 SAR interferogram [PNG: 984KB]
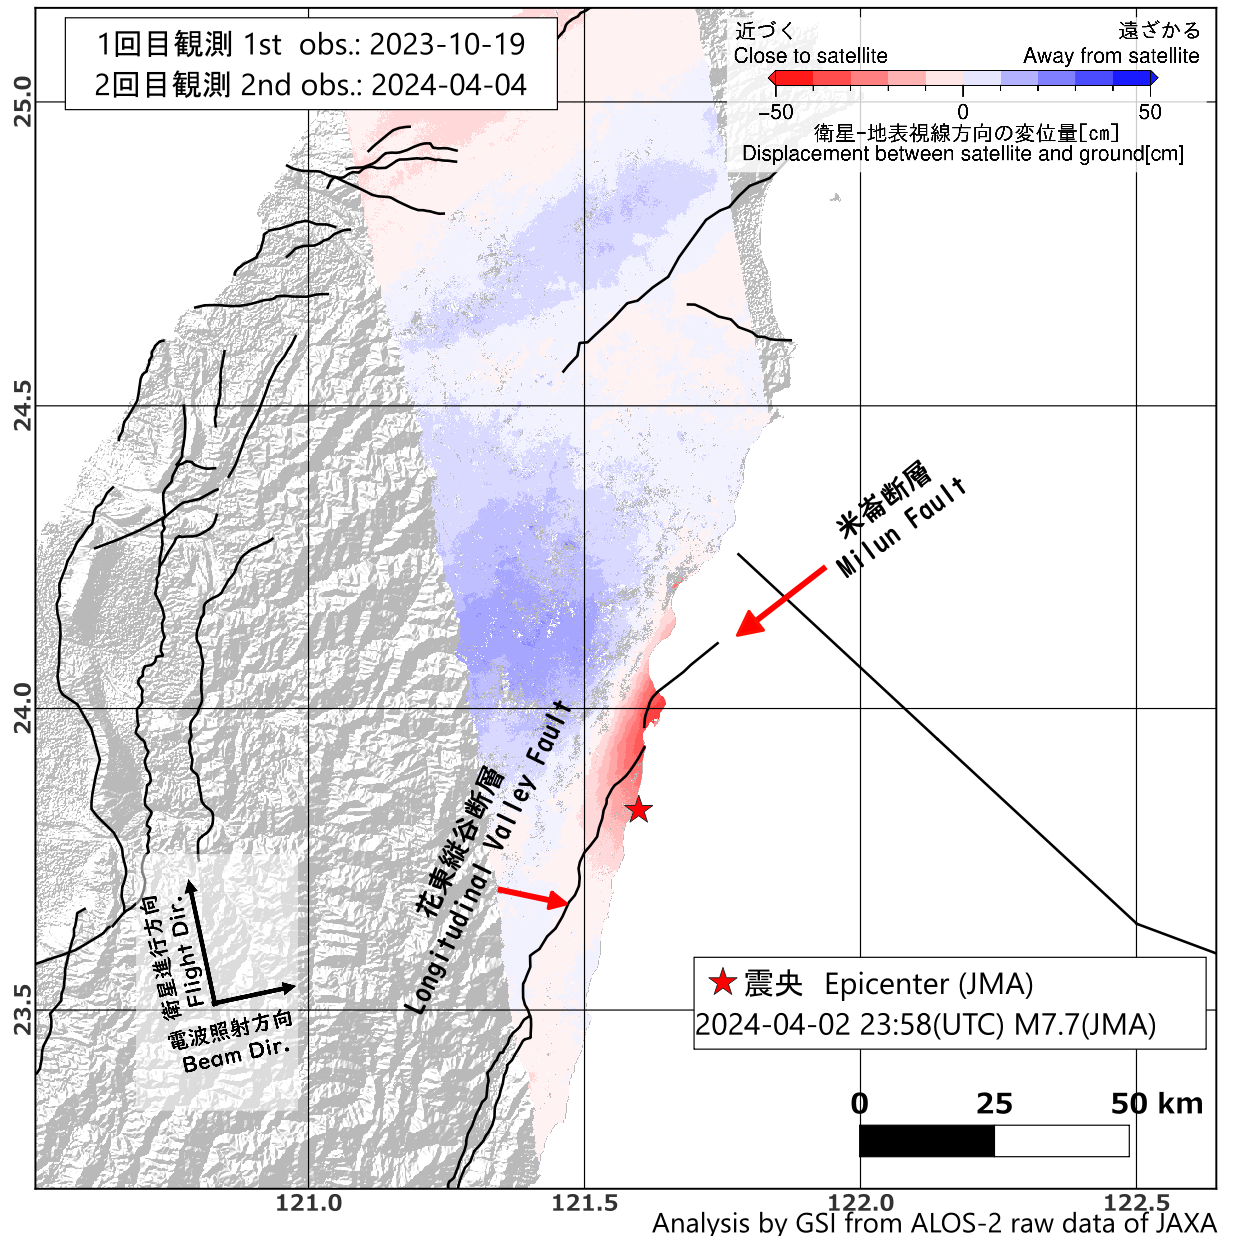
Fig. 5 SAR interferogram (Unwrapped) [PNG: 777KB]
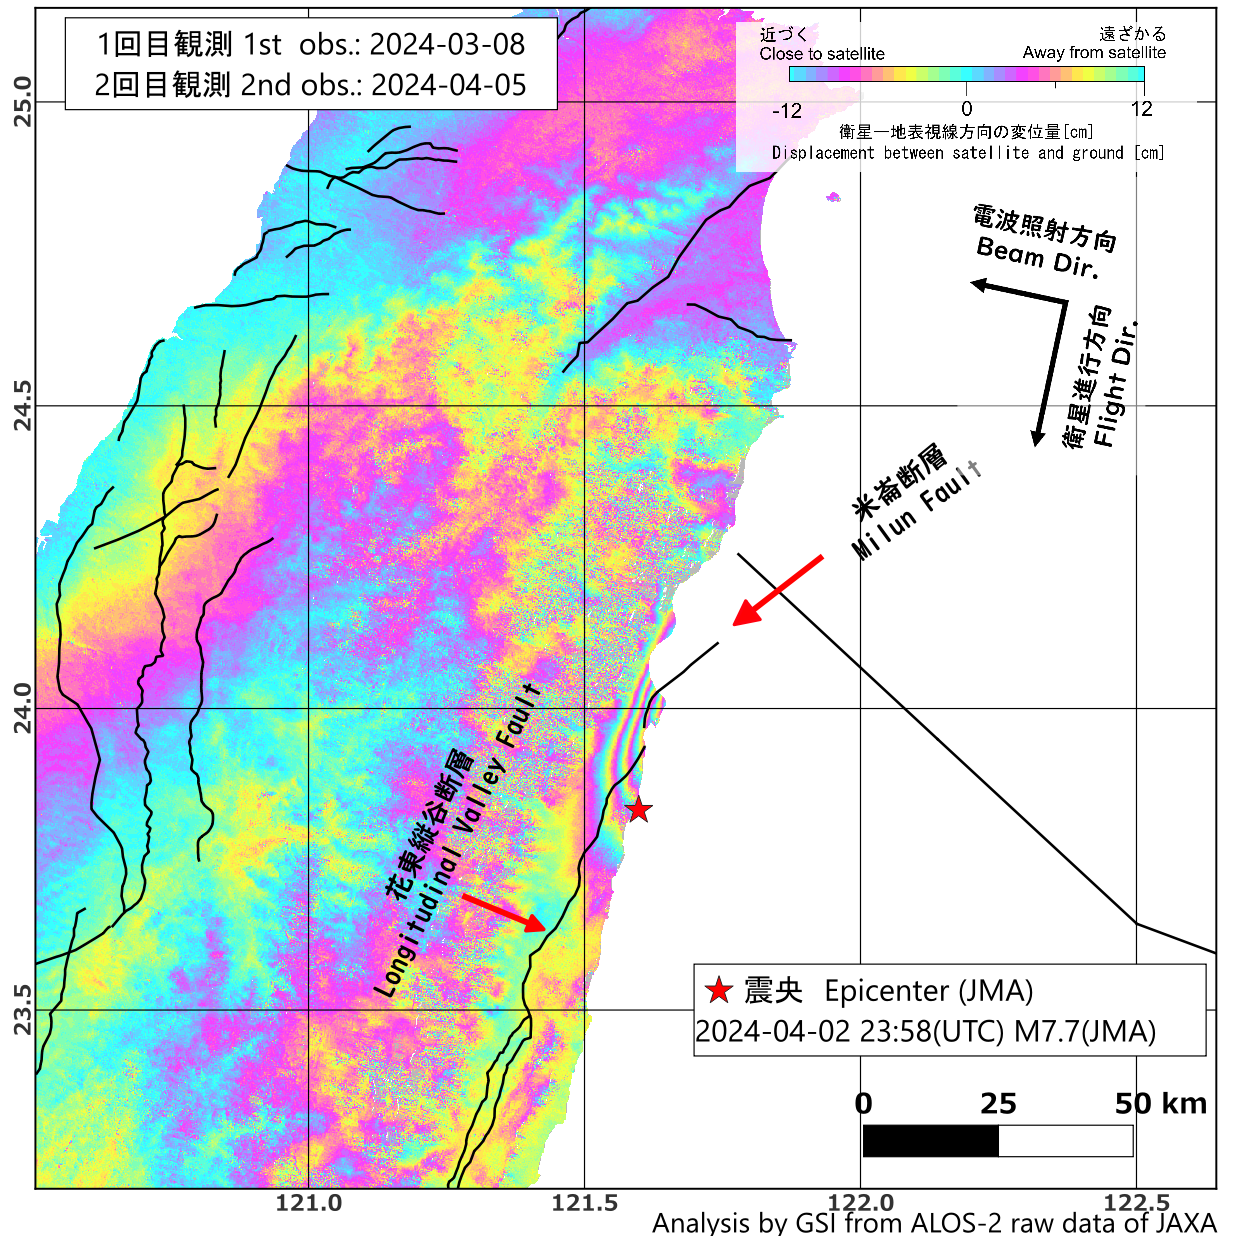
Fig. 6 SAR interferogram [PNG: 947KB]
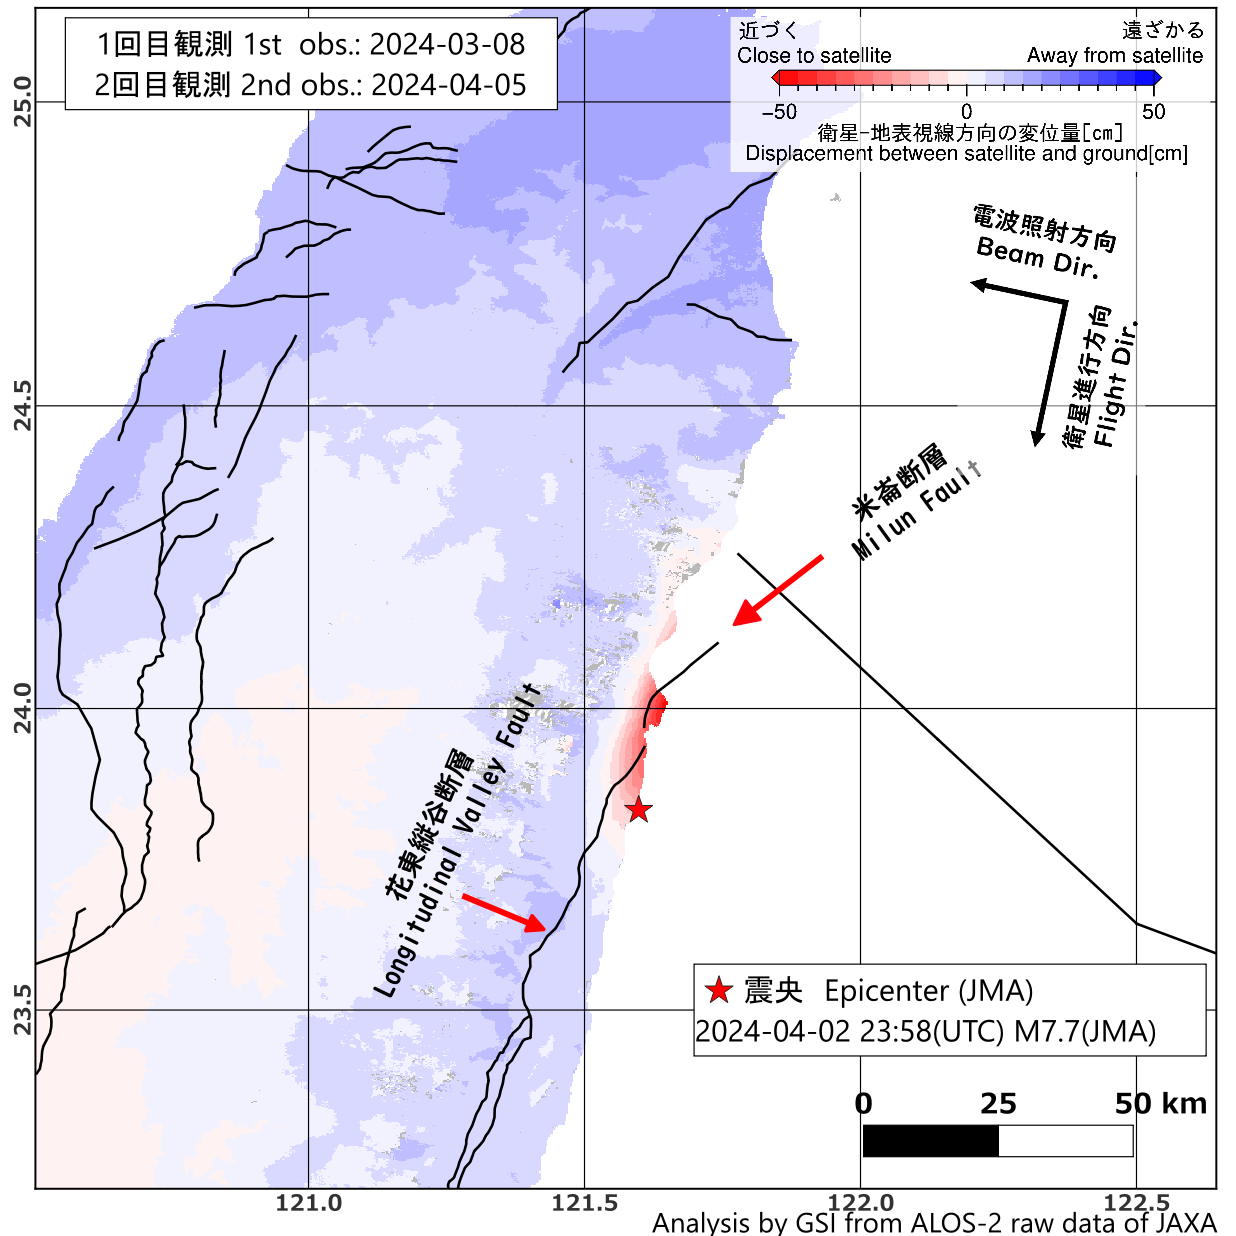
Fig. 7 SAR interferogram (Unwrapped) [PNG: 567KB]
Fig. 8 SAR interferogram [PNG: 1MB]
Fig. 9 range Analysis by GSI from ALOS-2 data of JAXA.
These results were obtained through the activity of the SAR analysis working group of the Coordinating Committee for Earthquake Prediction. The 2024 Taiwan Earthquake
SatelliteALOS-2 (Advanced Land Observing Satellite 2) launched by Japan Aerospace Exploration Agency on May 24, 2014
Copyrights and CreditsCopyright. Geospatial Information Authority of Japan. ALL RIGHTS RESERVED.
We welcome links from your website to this website. When using materials on this website, we ask that proper credit be given. ContactGeography and Crustal Dynamics Research Center
Crustal Deformation Research MUNEKANE Hiroshi: Head of Division 
Links[Reference information] Analysis results on April 17, 2024SummaryM7.7 (Japan Meteorological Agency; JMA) earthquake occurred in Taiwan on April 2, 2024 (UTC). To measure the crustal deformation caused by this earthquake, we applied interferometric analysis using ALOS-2/PALSAR-2 data. The analysis clearly revealed the spatial distribution of crustal deformation.
SAR Interferograms
Fig. 1 SAR interferogram [PNG: 995KB]
Fig. 2 SAR interferogram (Unwrapped) [PNG: 791KB]
Fig. 3 SAR interferogram [PNG: 847KB]
Fig. 4 SAR interferogram (Unwrapped) [PNG: 282KB]
Fig. 5 SAR interferogram [PNG: 1MB]
Fig. 6 range InSAR pair and The 2024 Taiwan Earthquake (Sourced by CWA)
*1 F: Stripmap (Fine), W:ScanSAR(Wide) (cf. ALOS-2 Project / PALSAR-2 (JAXA))
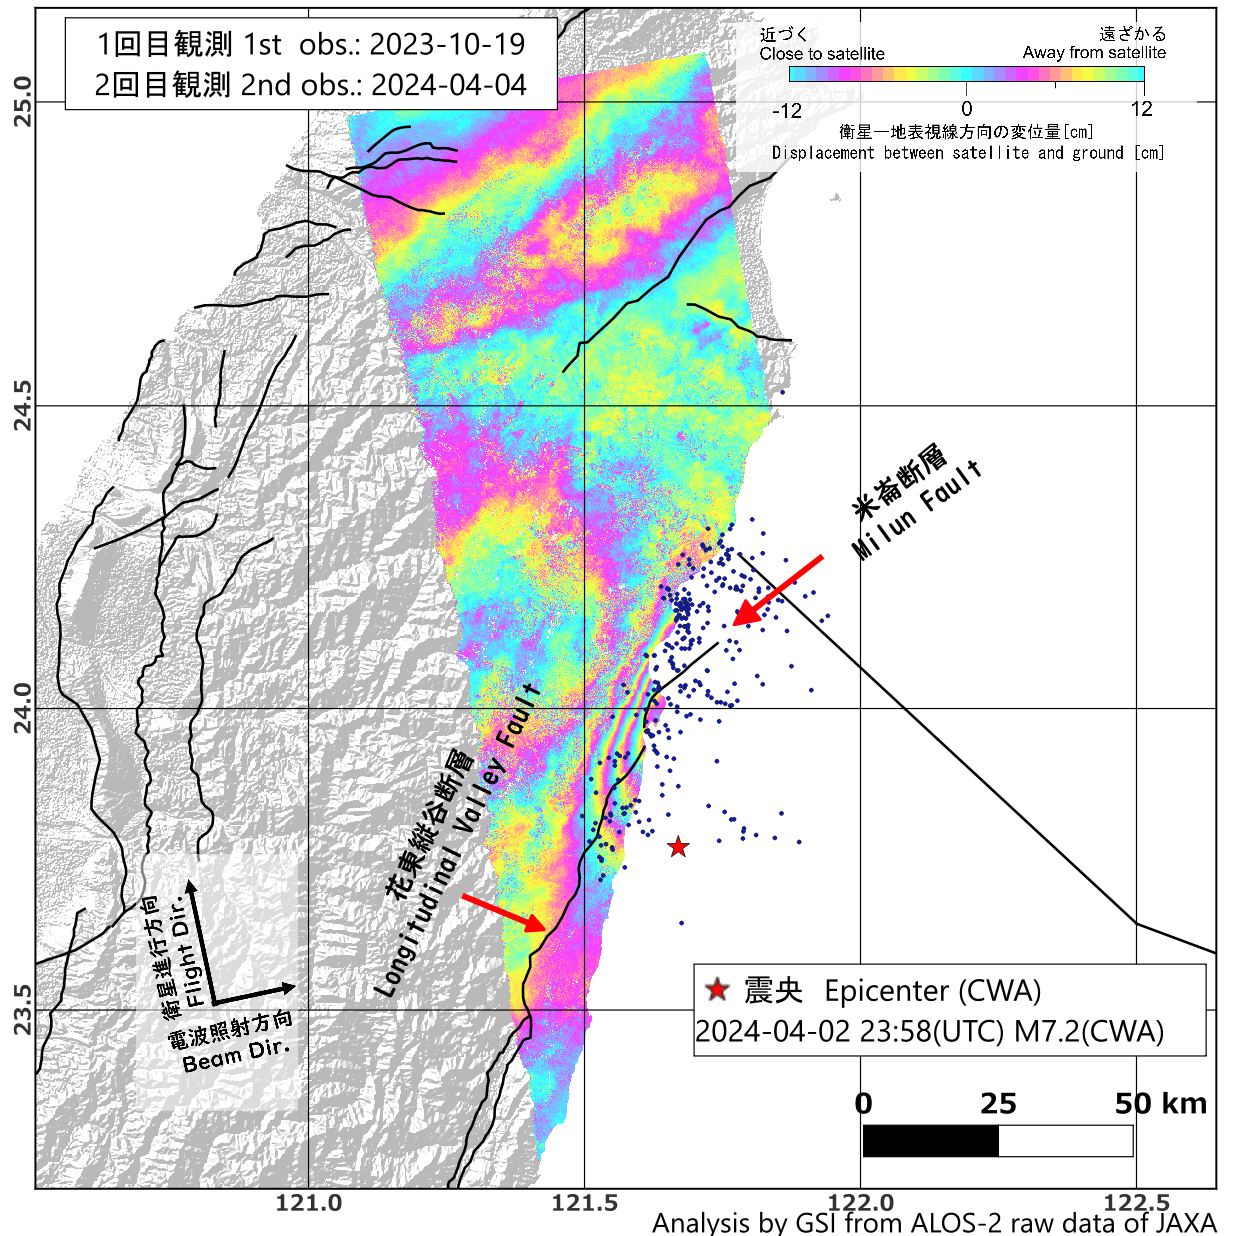
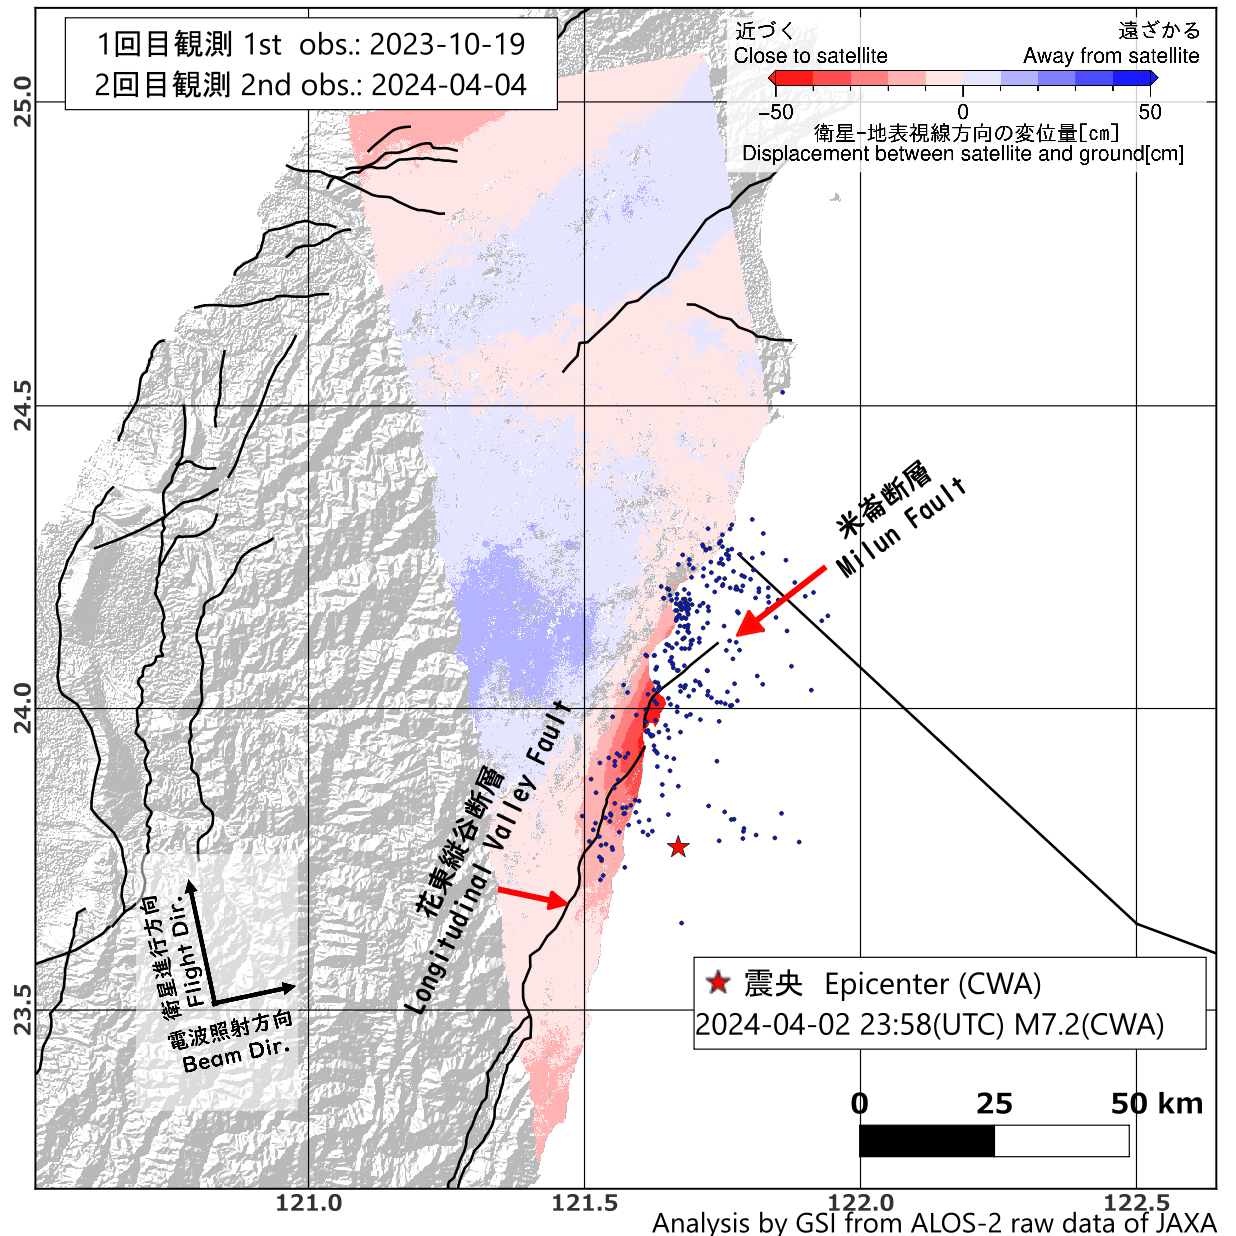
[Reference information] Analysis results on April 5, 2024SummaryM7.2 (Central Weather Administration; CWA) earthquake occurred in Taiwan on April 2, 2024 (UTC). To measure the crustal deformation caused by this earthquake, we applied interferometric analysis using ALOS-2/PALSAR-2 data. The analysis clearly revealed the spatial distribution of crustal deformation.
Crustal deformation is observed from the Milun Fault to the northern part of the Longitudinal Valley Fault. Maximum deformation reached 45 cm in the line-of-sight direction of the satellite.
SAR Interferograms
Fig. 1 SAR interferogram [PNG: 1014KB]
Fig. 2 SAR interferogram (Unwrapped) [PNG: 791KB]
Fig. 3 range The 2024 Taiwan Earthquake (Sourced by CWA)
|